SOFTWARE Riss-util Module
Contents
The riss_util module contains a variety of small programs and scripts developed by RISS staff to perform various bioinformatics tasks. The module is available on the lab cluster, Itasca, and Mesabi. To load the module run:
$ module load riss_util
Most of the scripts are written in perl. After loading the module you can view the source code for the scripts at /soft/riss_util/1.0/bin/. If neccessary you can copy a script to your home directory and modify it to suite your needs.
profile.pl
- NAME
- profile.pl - profile the cpu and memory usage of the computer
- SYNOPSIS
- profile.pl [-s seconds] [-h] [-i] [-b bins] [-o logfile]
- DESCRIPTION
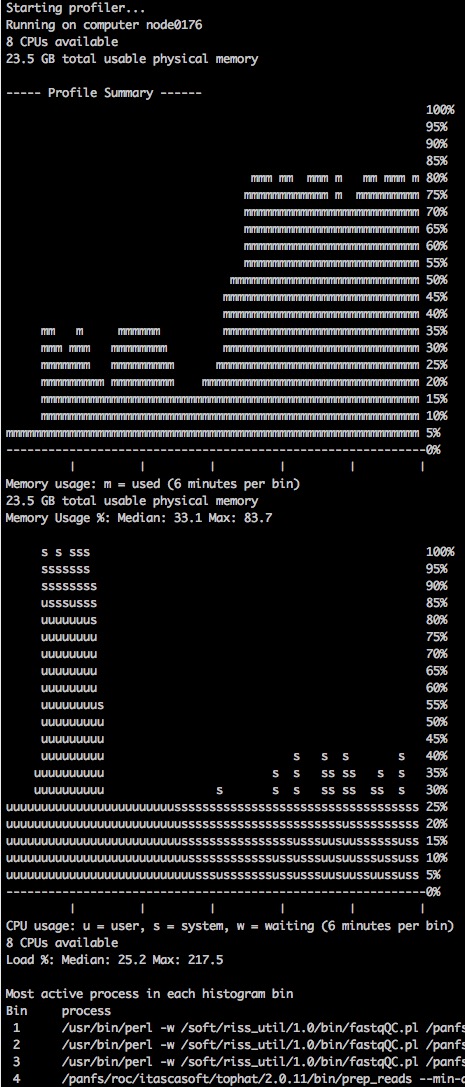
This script collects total memory and cpu usage information for the computer/node it is running on, and when the script is killed it prints ASCII plots to standard output summarizing memory and cpu usage across time. After the plots is a list showing the most active process in each bin in the plots.
- Options:
-s seconds The number of seconds between polling cpu and memory usage -b bins The number of bins in the summary histograms -i Interactive mode: print update to screen after every poll -h Display usage information -o file Print output to file instead of STDOUT
- EXAMPLE
Start profile.pl at the beginning of your pbs script (after loading the riss_util module) and put it in the background using “&”. Check the standard output file (jobname.oXXXXX) for the results:
$ profile.pl &
profiles.pl
- NAME
- profiles.pl - Run profile.pl on all nodes allocated to a job
- SYNOPSIS
- profiles.pl [-s seconds] [-h] [-i] [-b bins]
- DESCRIPTION
Generates memory and cpu usage information for multiple nodes. One nodeXXXX.log file is created for each node allocated to the current job.
- Options:
-s seconds The number of seconds between polling cpu and memory usage -b bins The number of bins in the summary histograms -h Display usage information
- EXAMPLE
Start profiles.pl at the beginning of your pbs script (after loading the riss_util module) and put it in the background using “&”:
$ profiles.pl &
multi-profile.pl
- NAME
- multi-profile.pl - profile the cpu and memory usage of a multi-node job
- SYNOPSIS
- multi-profile.pl [-s seconds] [-h] [-i] [-b bins] [-o logfile]
- DESCRIPTION
Generates one plot summarizing memory and cpu usage across all nodes in a multi-node job
- Options:
-s seconds The number of seconds between polling cpu and memory usage -b bins The number of bins in the summary histograms -i Interactive mode: print update to screen after every poll -h Display usage information -o file Print output to file instead of STDOUT
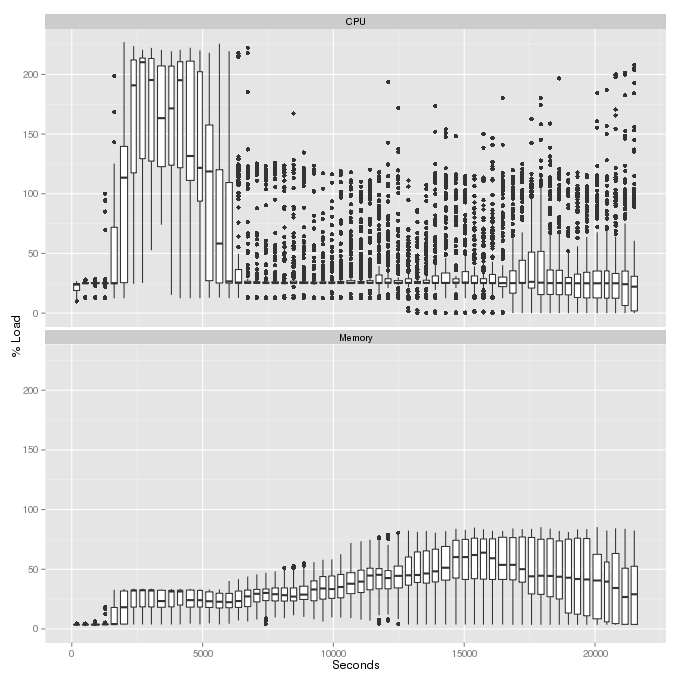
EXAMPLE Start multi-profile.pl at the beginning of your pbs script (after loading the riss_util module) and put it in the background using “&”. View the profile.png image after the job finishes. The plots use boxplots to show the distribution of memory and cpu usage across all nodes at each timepoint bin. The top plot shows CPU load percentage, which is the number of threads running or ready to run, divided by the number of cores (thus the load can be higher than 100%):
$ multi-profile.pl &
cleanup
- NAME
- cleanup - delete all but the most recent pbs.e and pbs.o output files
- SYNOPSIS
- cleanup [-d]
- DESCRIPTION
Submitting the same pbs script to a queue multiple times results in many different standard error and standard out files. This script will delete all of the old files for you, leaving the most recent pair of files. This script finds all files ending in .pbs.e00000 and .pbs.o0000 and removes all but the most recent (as determined by the job number, not the file modification dates) .e and .o file for each .pbs file. Run without any options the script lists which files should be deleted and which should be kept. Run with the -d option the script will actually delete files.
- Options:
-d Delete old .e and .o files
fastqqualityplot.pl
- NAME
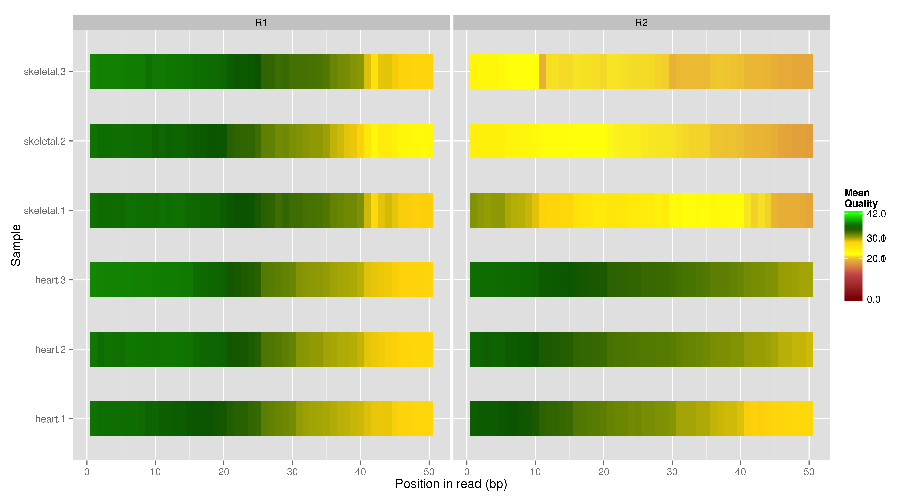
- fastqqualityplot.pl - Generate per-base quality plot for multiple fastq files
- SYNOPSIS
- fastqqualityplot.pl -f /fastq/folder [-m mappingfile]
- DESCRIPTION
Generate per-base quality plot for multiple fastq files
-f folder A folder containing fastq files to process -m file Full path to a mapping file -o file Name of the output image file (fastqqualityplot.png) -p integer Number of processors to use (number of threads to run) (this doesn’t work yet...) -s integer Subsample the specified number of reads from each fastq file. 0 = no subsampling -h Print usage instructions and exit -v Print more information while running (verbose) - EXAMPLE
Run the script:
$ fastqqualityplot.pl -f /home/msistaff/public/garbe/sampledata/RNAseq/Hsap/fastq/ -s 4000 -o fastqqualityplot-sample2
insertsize.pl
- NAME
- insertsize.pl - Calculate the insert size mean and standard deviation of a paired-end dataset
- SYNOPSIS
- insertsize.pl [-m 1] bowtieindex R1.fastq R2.fastq
- DESCRIPTION
Calculate the insert size mean and standard deviation by aligning some reads from a pair of fastq files to a bowtie2 index
-b bowtieindex A Bowtie2 index -m integer The first N million reads from the fastq files will be aligned (Default 1) -p integers Number of threads to use (Default $PBS_NUM_PPN or 1); -h Print usage instructions and exit -v Print more information while running (verbose) - EXAMPLE
Run the script:
$ insertsize.pl bowtieindex R1.fastq R2.fastq
Runtime: 15 seconds using “-m .1 -p 8” on Itasca, 102 seconds using “-m 1 -p 8” on Itasca
insertplot.pl
- NAME
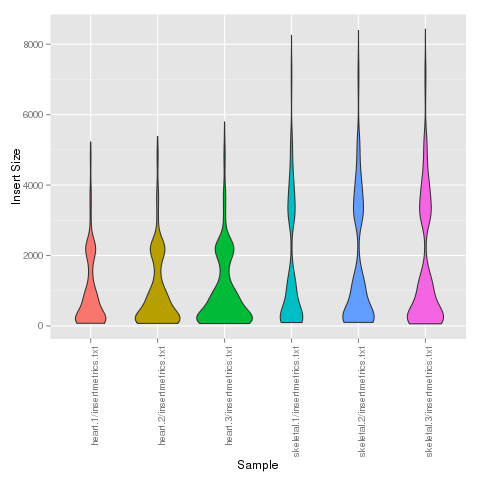
- insertplot.pl - generate a fragment-length plot from Picard output
- SYNOPSIS
- insertplot.pl insert_summary1.txt [insert_summary2.txt ...] insertplot.pl -f filelist.txt
- DESCRIPTION
Generate a plot summarizing multiple Picard-tools insert-size-metrics output files. R is required, as well as the R package ggplot2.
- Options:
- -f filelist.txt : provide a file with a list of picard insert-size-metrics output files, one per line. A
- second tab-delimited column may be included containing sample names
- -h : Print usage instructions and exit -v : Print more information whie running (verbose)
- EXAMPLE
Generate a plot from six different picard output files:
$ cd /home/msistaff/public/garbe/sampledata/RNAseq/Hsap/analysis
$ insertplot.pl heart.1/insertmetrics.txt heart.2/insertmetrics.txt heart.3/insertmetrics.txt skeletal.1/insertmetrics.txt heart.2/insertmetrics.txt heart.3/insertmetrics.txt
fastq-species-blast.pl
- NAME
- fastq-species-blast.pl - Given a fastq file, blast a sample of the sequences and count how many hits there are to each species.
- SYNOPSIS
- fastq-species-blast.pl [-n number_of_sequences_to_blast] [-t num_threads] [-d blast_database(s)] input.fastq
- DESCRIPTION
- fastq-species-blast.pl can be used to blast a small number of fastq reads against a BLAST database in order to determine what species the fastq file contains, and if there are significant amounts of contaminating sequence from other species. The -n option is used to specify how many reads from the input.fastq file shoule be BLASTed (default is 10). The -t option specifies how many processor cores to use (default is 1, this script cannot run across multiple nodes). The -d option specifies which BLAST database to use (default is htgs). Any database installed with the local NCBI Blast installation can be used (the taxdb must be installed). Multiple databases can be blasted against: fastq-species-blast.pl input.fastq -d “human_genomic vector”
- EXAMPLE
Blast 10 fastq sequences (the default) against the htgs database (the default):
$ fastq-species-blast.pl
/home/msistaff/public/garbe/sampledata/RNAseq/Hsap/fastq/heart-1_R1.fastq
6 out of 10 sequences (60%) have a hit in the htgs blast database
   Common name               Scientific name      # of sequences
   grivet                    Chlorocebus aethiops 1
   cattle                    Bos taurus           1
   white-tufted-ear marmoset Callithrix jacchus   1
   human                     Homo sapiens         3
fastq-cat.pl
- NAME
- fastq-cat.pl - Concatenate FastQC files
- SYNOPSIS
- fastq-cat.pl /fastq/folder
- DESCRIPTION
This script identifies samples spread across multiple fastq files and generates cat commands to concatenate them together. Symlink commands are generated for single-file samples. This script only generates the commands to concatenate and link files. Run “fastq-cat.pl FOLDER | bash” to generate the concatenated and linked files.
Options:
-f FOLDER Folder containing fastq files - EXAMPLE
Create a directory to contain the concatenated files:
$ mkdir fastq-cat
$ cd fastq-cat
Generate the concatenation commands:
$ fastq-cat.pl ~/fastq-files > fastq-commands.txt
Execute the concatenation commands:
$ bash fastq-commands.txt
redup.pl
- NAME
- redup.pl - Remove exact duplicate reads from paired-end fastq files
- SYNOPSIS
redup.pl [-n N] sample1_R1.fastq sample1_R2.fastq > topdups.fasta
- Options:
-n integer Print out this many of the most duplicated sequences -h Display usage information
- DESCRIPTION
- This script removes duplicate paired-end reads from the input files sample1_R1.fastq and sample1_R2.fastq and prints out unique reads to the files sample1_R1.fastq.unique and sample2_R2.fastq.unique. Reads must have the exact same sequence to be called duplicates, quality scores are ignored. The top N (default 20) most duplicated sequences are printed out in fasta format, making it convenient for using BLAST to identify them.
resync.pl
- NAME
- resync.pl - Resynchronize a pair of paired-end fastq files.
- SYNOPSIS
- resync.pl sample1_R1.fastq sample1_R2.fastq [sample1_R1_synced.fastq sample1_R2_synced.fastq]
- DESCRIPTION
Programs that process paired-end fastq files usually require that the Nth read in the R1 fastq file and the Nth read in the R2 fastq file are mates. Using trimming or filtering programs that aren’t paired-end aware often results in reads being removed from one paired-end fastq file but not the other, resulting in “unsyncronized” files. This program reads in two unsynchronized fastq files and writes out two synchronized fastq files. The synchronized files have properly paired reads, with singleton reads removed. Casava 1.7 and 1.8 read ID formats are supported. This program shouldn’t use much memory (<1GB), but maximum memory use could be equivalent to the size of one input file in a worst-case scenario.
- Options:
- -h : Display usage information -s : Save singletons to .singleton files
fasterqc.pl
- NAME
- fasterqc.pl - Combine FastQC output images
- SYNOPSIS
- fasterqc.pl [-s 100] [-o fasterqc.png]
- DESCRIPTION
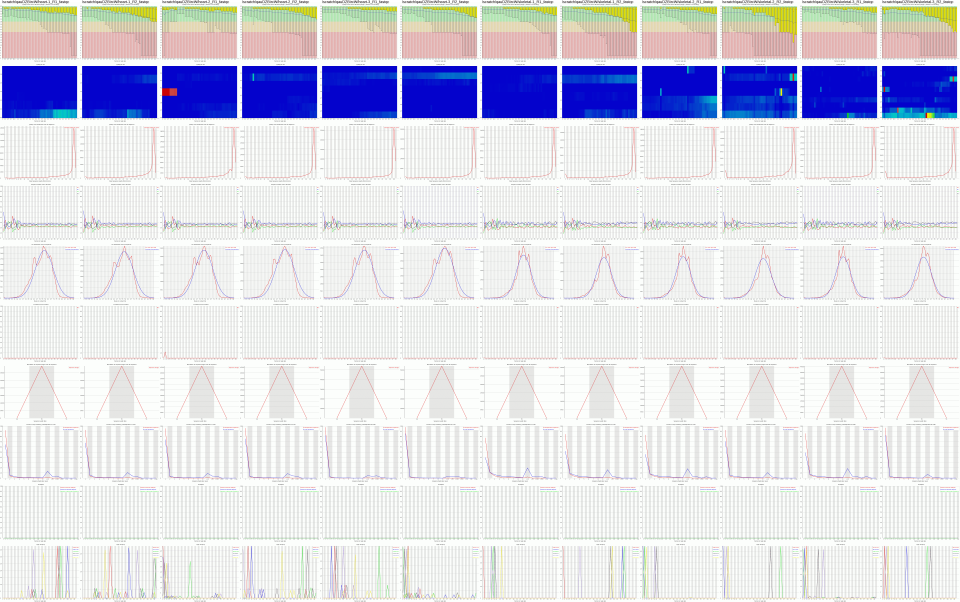
This script combines FastQC output images into one large png image to make it easy to quickly assess the FastQC output from many samples. When FastQC is run it generates a zip file named SAMPLENAME_fastqc.zip. Run this script in a folder containing one or more of these SAMPLENAME_fastqc.zip files and it will generate a single image containing all of the FastQC images from all samples. It also prints out the “overrepresented sequences” for each sample to the file fasterqc.overrep.txt. Recommended maximum number of fastqc folders is 50. This script works with older and newer versions of FastQC, but won’t work with a mix of old and new version FastQC output files.
- Options:
-s percent Scale the final image by the specified percent (valid range 5-100, default 100). Files larger than 5000 pixels wide are automatically scaled to 5000 pixels wide -o file Save the final image in the specified file (default fasterqc.png)
- EXAMPLE
Consolidate the results from 12 FastQC runs into one tiny image:
$ cd /home/msistaff/public/garbe/sampledata/RNAseq/Hsap/fastq/fastqc
$ fasterqc.pl -s 10 -o fasterqc-sample.png
tophatplot.pl
- NAME
- tophatplot.pl - Generate plots from tophat align_summary.txt output files
- SYNOPSIS
- tophatplot.pl align_summary1.txt [align_summary2.txt ...] tophatplot.pl -f filelist.txt
- DESCRIPTION
Generate a plot summarizing mapping percentage for multiple samples
- Options:
-f file Provide a file with a list of align_summary.txt files, one per line. A second tab-delimited column may be included containing sample names. A third column may be included containing bam files from mapping unmapping reads against a spike-in control reference -h Display usage information
EXAMPLE


expressiontableplot.pl
- NAME
expressiontableplot.pl - Given a table of expression data, generate a series of summary plots including:
-MDS plot -Dendogram -Expression distribution violin plots -Expressed genes plot- SYNOPSIS
- expressiontableplot.pl data.txt
- DESCRIPTION
Generate a series of plots summarizing a table of expression data. The input file should be tab delimited with a header. There should be a row for each feature (gene, transcript, exon, etc), and a column for each sample. The first row should contain sample names and the first column feature IDs.
- Options:
-n Normalize expression values: 75% quartile normalization -m integer Minimum expression value -t string Feature type (gene, transcript, exon, etc) -h Display usage information -v Verbose output
EXAMPLE


Deprecated scripts
These scripts are no longer supported:
tophatstatsPE.pl: Tophat now produces a file name align_summary.txt containing alignment statistics. Use tophatplot.pl to summarize multiple align_summary.txt files cuffplot.pl: Use cuffdiffplot.pl instead, it genreates more plots and uses ggplot2 instead of gnuplot cuffdiff2_mds_plot.pl: Use cuffdiffplot.pl instead, it generates an mds plot as well as several other useful plots
Support
There is a discussion thread for the riss_util module in the MSI google group: https://groups.google.com/a/umn.edu/forum/#!categories/msi-user-questions/software Updates and changes to programs in the riss_util module are posted to the thread, and you may post feature requests or bug reports to the thread. You may also email RISS at help@msi.umn.edu